
Activity 4: Sketch Recognition
In the previous activities, you used the Google Teachable Machine tools to create a machine learning model. You couldn’t really see much of the math that is happening behind the scenes to determine which class a sample belongs to. In this activity, you will actually create a simple machine learning model yourself to get an idea of what is going on behind the scenes. This activity was based on a video tutorial from Jens Moenig, one of the creators of Snap!.
You will be creating your own blocks and using lists extensively in this activity, so make sure you have completed the Snap! modules on Lists and Modularity.
This activity consists of several steps that will guide you through implementing what is known in machine learning as a nearest-neighbor algorithm.
Creating Samples


If you are using the BlueBird Connector, start by opening this starter file in Snap!. This file already contains some code and some custom blocks that you will use.
If you are using snap.birdbraintechnologies.com, start by importing this project into Snap!.
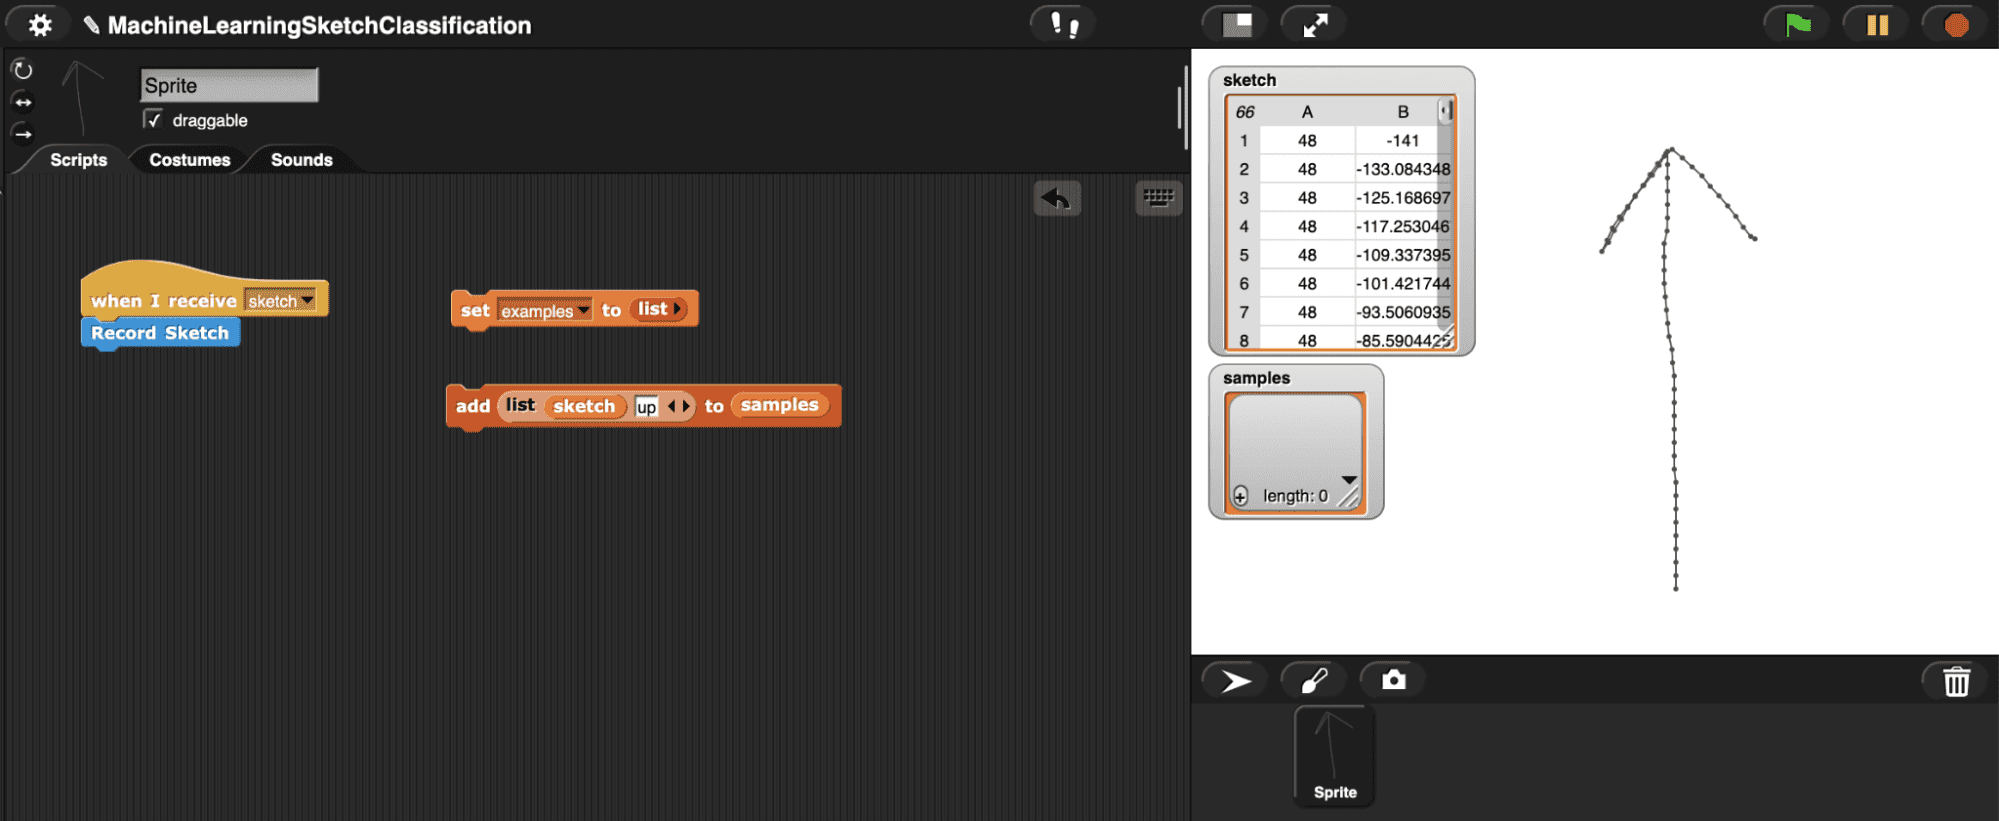
Click and hold while drawing on the stage. You will see that this project records your drawing. As you are drawing, you will see your path as a thick line on the stage. After you finish drawing, this will transform to a thin line connected by dots. This shows that your drawing has been transformed into a list of 64 points. These points are shown in the list variable named sketch shown on the stage. The left column represents the x-coordinates of the points, and the right color represents the y-coordinates. Try drawing a couple of simple shapes.

Before you create a model, you will need some samples. In this activity, you will only use a single sample for each class. You will save your samples in a list called samples, which is also shown on the stage. If this list is not empty, click the set block to set it equal to an empty list.

Draw an up arrow on the screen. When you have an arrow you like, click the add button to add this drawing to samples with the label “up.”
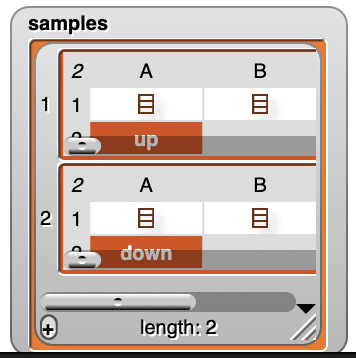
Next, draw a down arrow on the screen and add it to samples with the label “down.” When you have finished, samples should look like this.
Making a Model
Computing the Difference Between a Two Sketches

Now it is time for some math. Take a look at the Sensing menu. You will see a custom block called distance from.
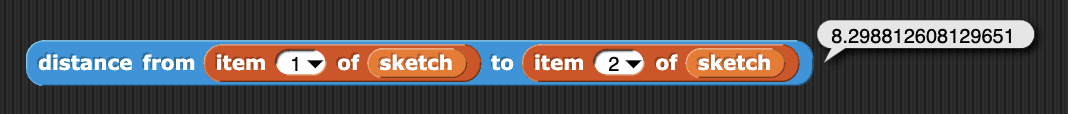
You can use the distance from block to measure the distance between two points. For example, you can measure the distance between the first and second points in a sketch. To learn more about this block (or any other custom block!), you can right-click on the block and select edit to look at the code within it.
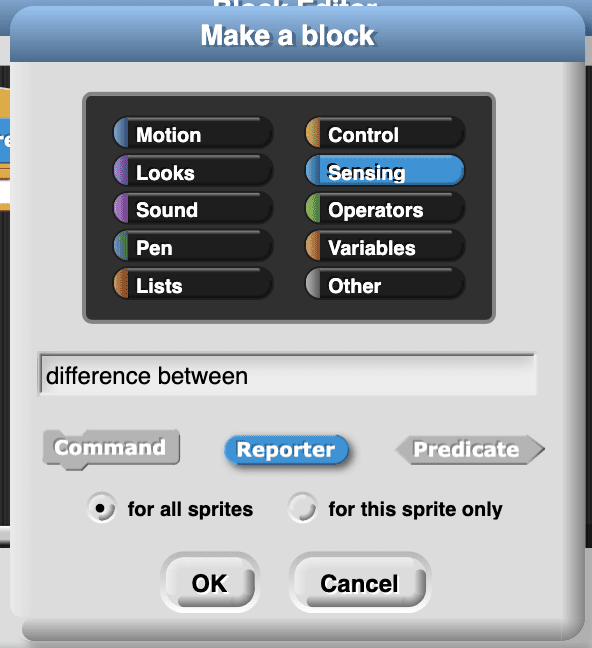
First, you are going to use the distance from block to create a custom block to measure the difference between two sketches. Create a block named difference between. This block will report a value.
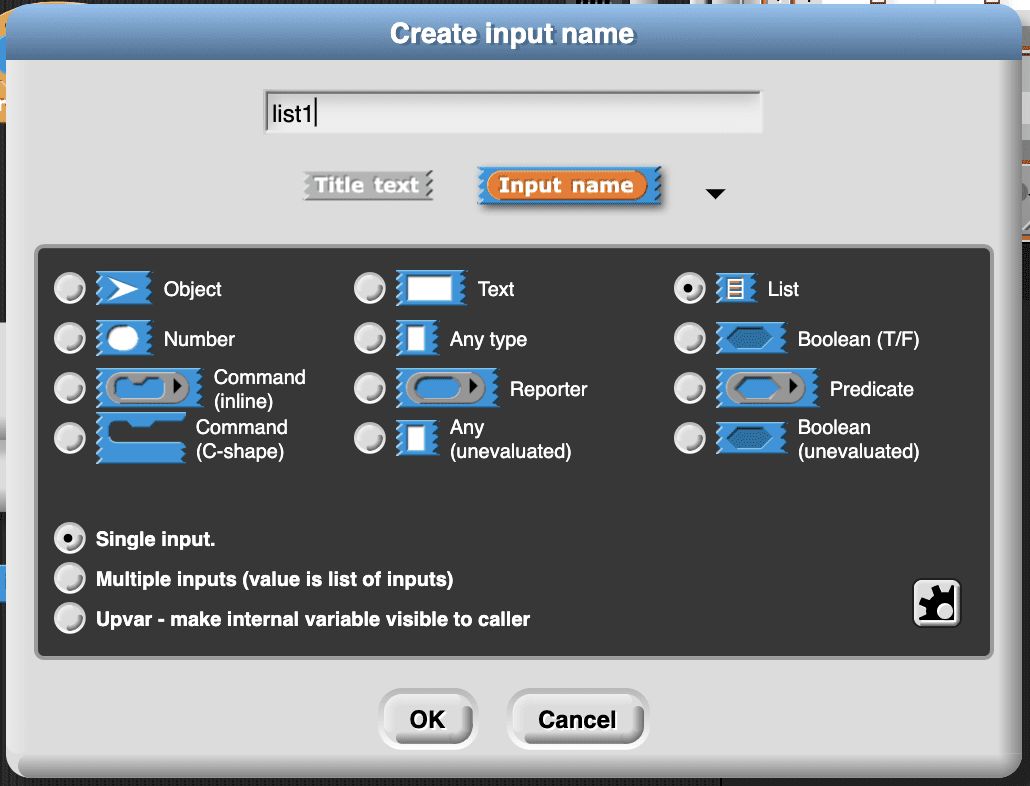
Next, add two parameters for this block, list1 and list2. Set the type of both parameters to be a list.
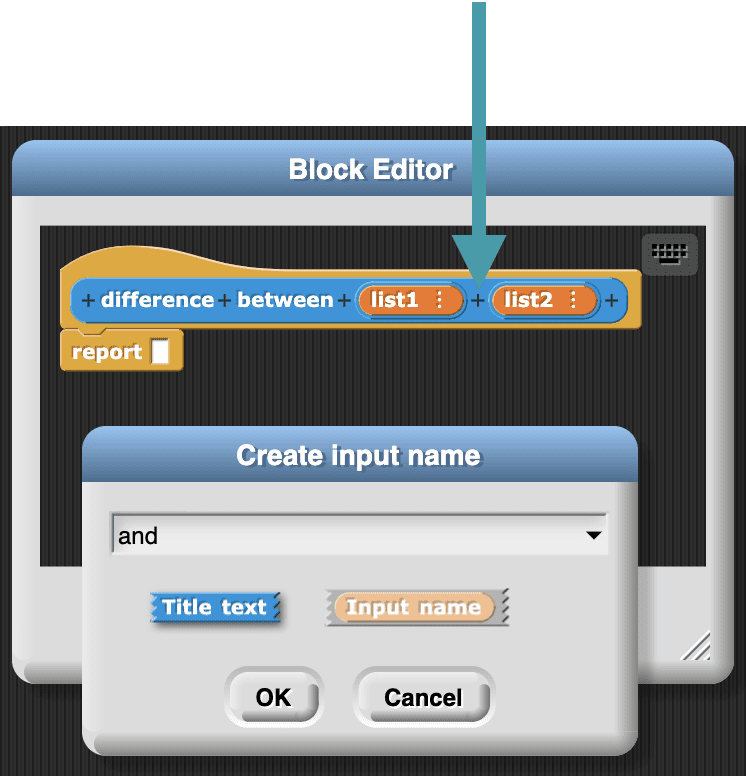
Click on the + sign between the two parameters and add the text “and” to the block title to make it more clear that this block will find the difference between the two lists.
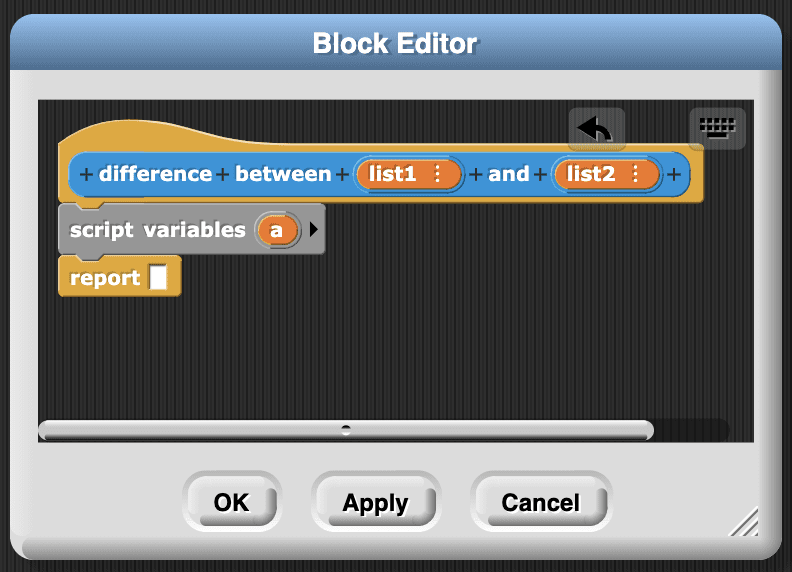
This custom block will use a script variable, which is a variable that is only defined within this block. You can find the script variables block on the Variables menu.
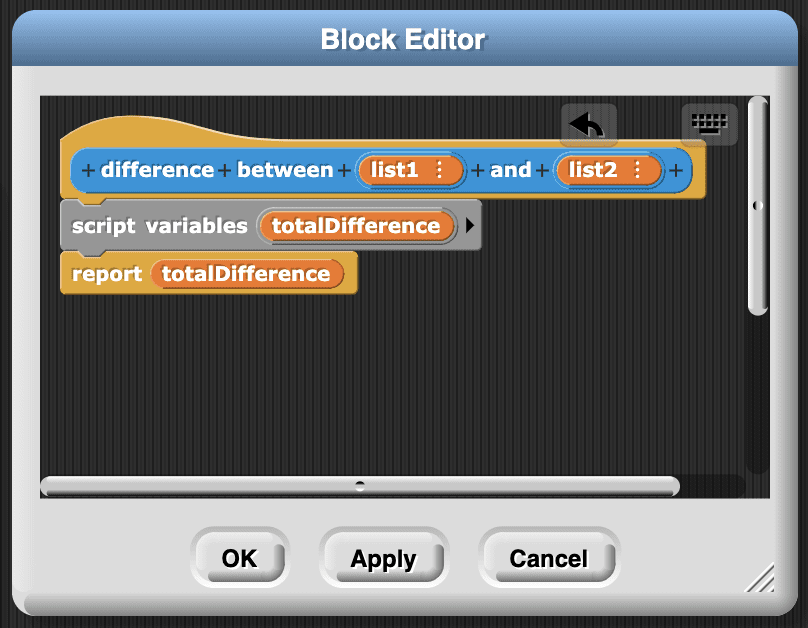
Click on the script variable to rename it totalDifference. This is the value that your block is going to report, so click on the variable in the script variables block and drag it into the report block.

The value of totalDifference should start at 0. Then we will use a for loop to move through every point in list1.
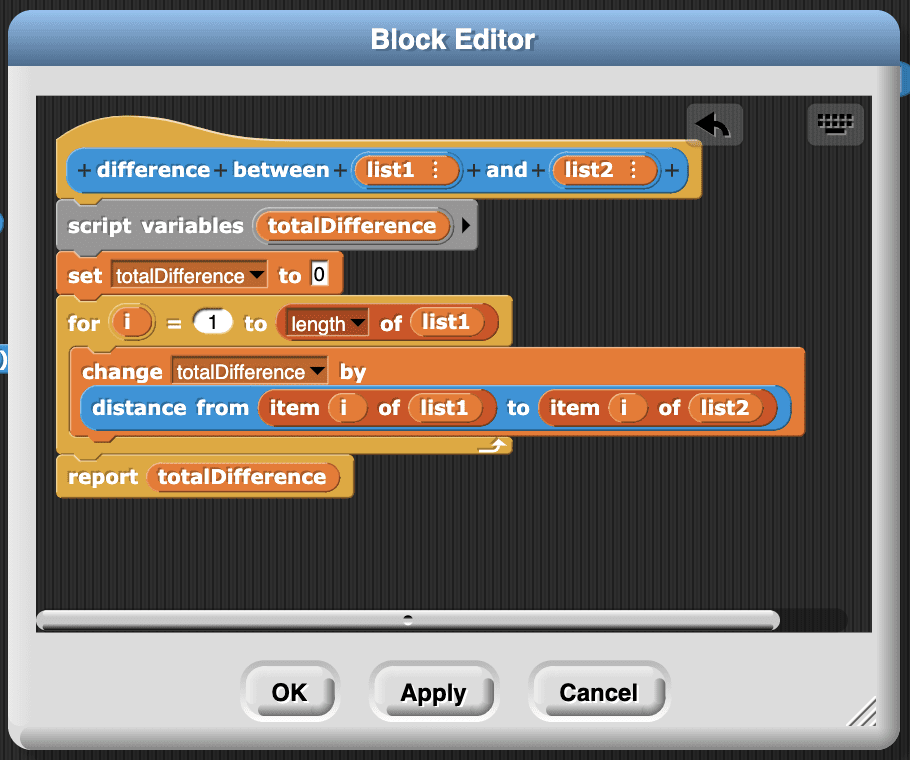
For each point in list1, we want to find the distance between that point and the corresponding point in list2 and add that distance to totalDifference. Notice that it is very important that list1 and list2 have the same number of points, but that is taken care of by the fact that all our sketches have 64 points.

As a final step, place a warp block (Control menu) around the for loop. This will make your Snap! program run faster (it is performing a lot of calculations!).

To test your new block, make a sketch and find the difference between that sketch and the first drawing in samples (do not add your new sketch to samples). Remember, the variable samples is a list of lists. The first item in samples is a list that contains two items: the first sample drawing and the class name for that drawing (“up”). That means that we need two item blocks to access the first sample drawing.
Classifying a New Sketch
The next step in building your model is to use your difference between block to compare a new sketch to each sample. You will also build a custom block for this.
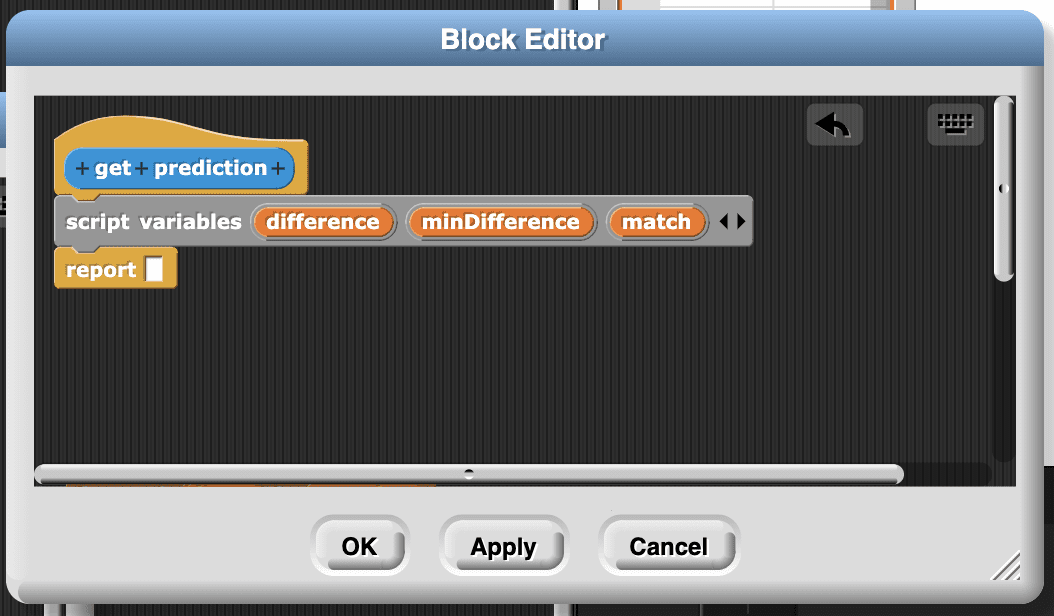
Create a new block named get prediction. This block will report a value. Create three script variables named difference, minDifference, and match. Use the black arrows on the right end of the script variables block to add or remove script variables.
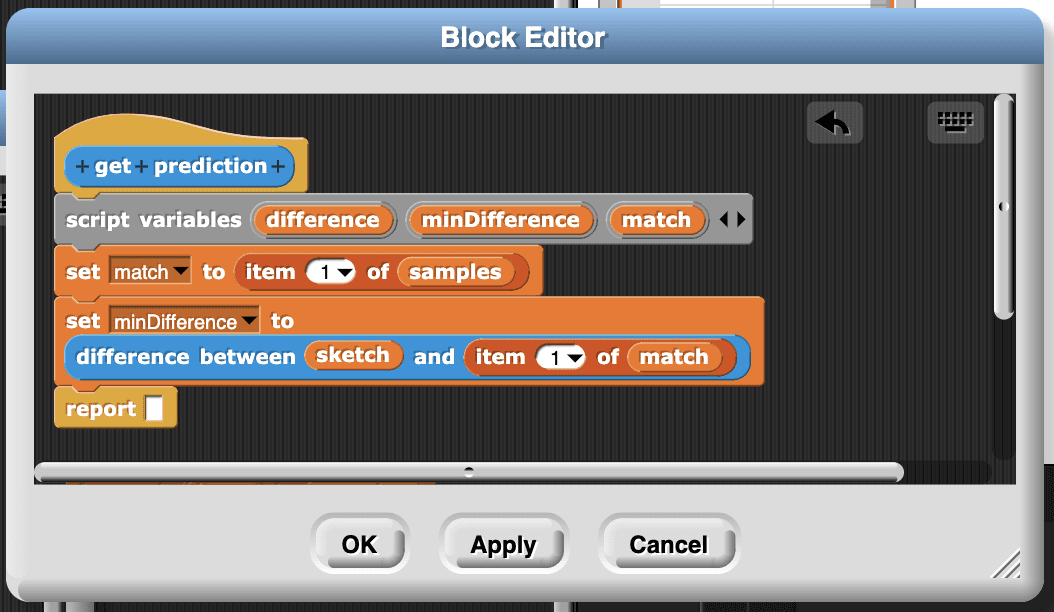
We will start by assuming that the first sample is the match. This means that we will initialize match to the first item in samples, which is itself a list containing the sample drawing (item 1) and its label (item 2). We will initialize the minimum difference to the difference between sketch and the drawing for our starting value of match.

After initializing match and minDifference, we will move through the samples list to see if we find a better match. To move through each one of our samples, we can use the for each block from the Variables menu. This loop is similar to a for loop, but instead of a variable i, we have a variable named item that takes on each value in the list in turn. For example, the first time through our loop, item is equal to the first item in the samples list. The next time through the loop, it is equal to the second item in samples, and so on.
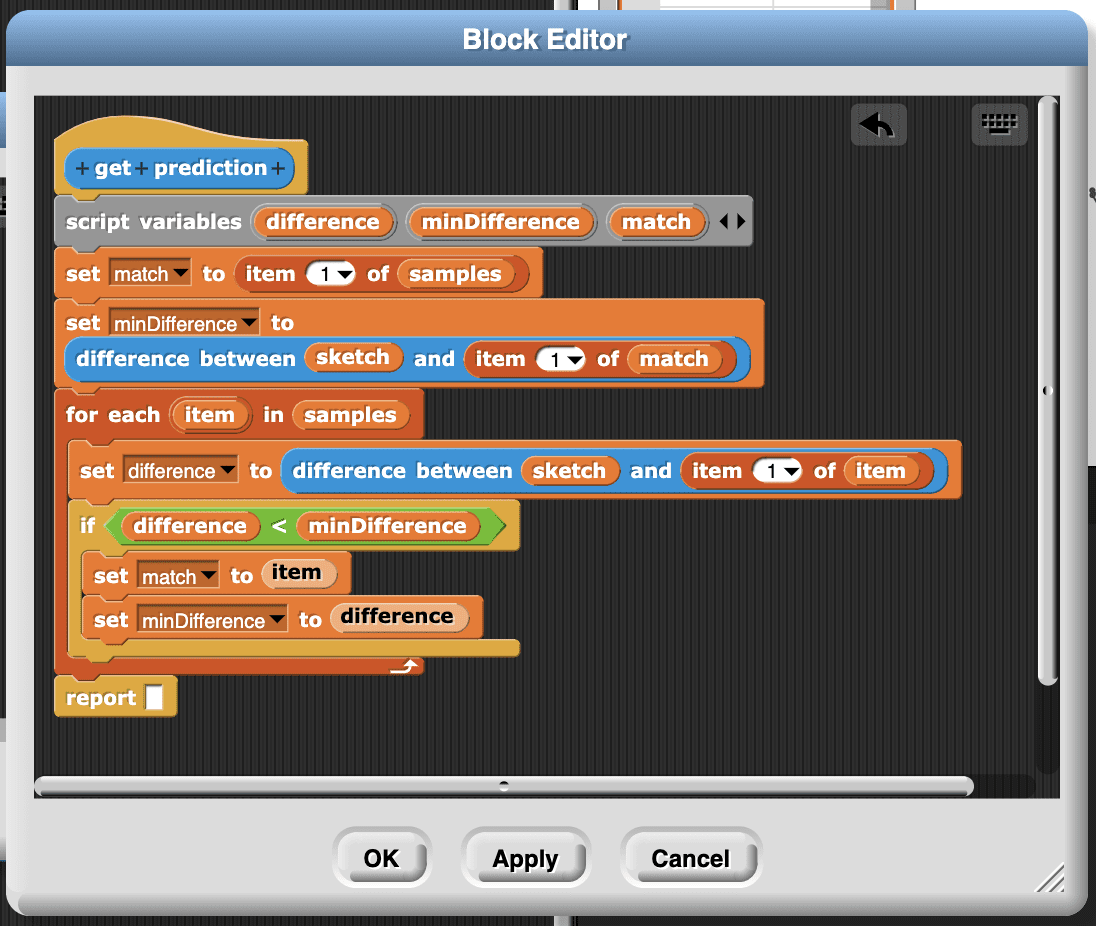
For each value of item, we want to calculate the difference between sketch and the drawing for that sample (item 1 in item). If this difference is less than the minimum we have found so far, we want to reset our values of match and minDifference to the current values of item and difference, respectively.
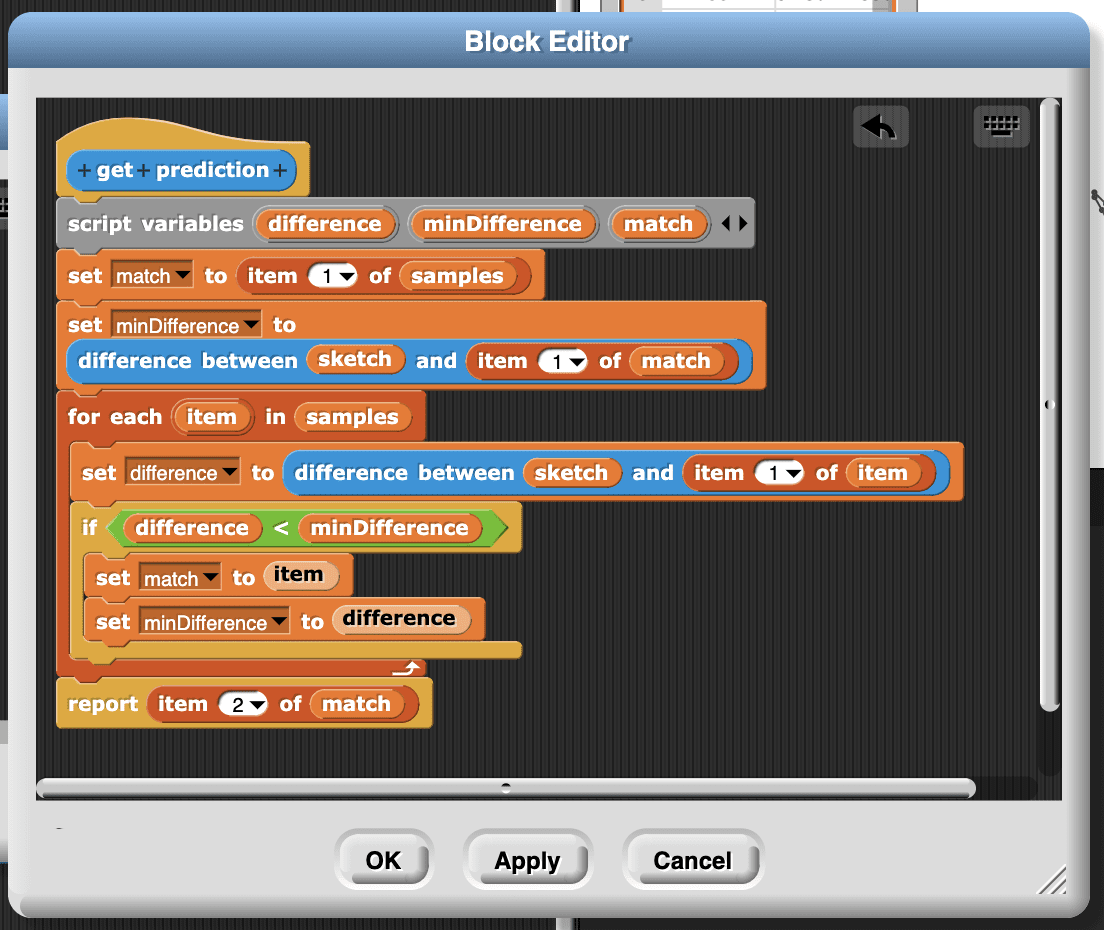
The last step in this block is to return the class label for match! That is our best guess as to which of the sample drawings is closest to sketch. This is what is known as a nearest-neighbor algorithm, because we are trying to estimate which of our samples is “closest” to the current sketch.
Test your new block, draw an arrow and then click your get prediction block. Does your sketch match the sample you expected?
Now that you have a basic model, you can add samples of other drawings to expand your model.
Using the Model
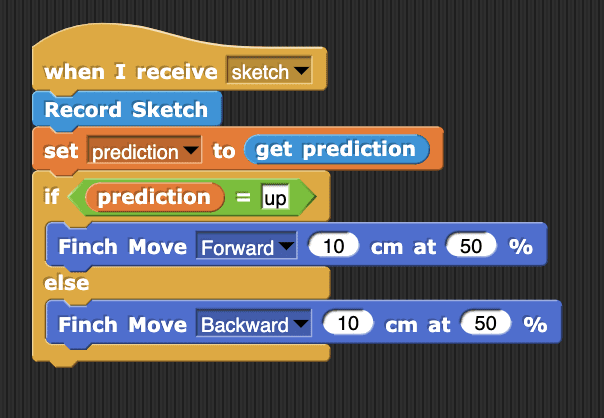
Now that you have completed your model, each time you create a sketch, you can save your prediction in a variable and use it to control the Finch. How can you use drawings to control the Finch?
Congratulations, you have created your very own machine learning model! This was an involved process, even for a relatively simple model where we used only one sample for each class. Machine learning requires an enormous amount of computation, which is why it has only been developed since computers became cheap and fast. The calculations used by the Google Teachable Machine models and other machine learning models are far larger and more complex than what we have done here, but the idea is pretty similar. To make a prediction, the teachable machine looks through all the data and determines which class is “closest” to the current observation. Machine learning algorithms differ by how they separate the classes and how they compute what is “closest.”