Register to receive free access to all teacher materials.

l Projects
Lesson Level
Beginner
Created By
This activity is based on one by Chris Pautler of Goddard Middle School (Littleton, CO).
Programming Language
Snap!
Subjects
Math
Grades
4-5, 6-8, 9-12
Standards
This activity is aligned with Common Core elementary math standards for measuring and graphing data (4.MD.B, 5.MD.B, and 5.G.A). For these students, you can eliminate the linear equation portion of the activity. Instead, students can use the graph to estimate the wait time needed for a particular angle. For middle school, this activity is aligned with Common Core math standards that involve the coordinate grid (6.SP.A); proportions (6.RP.A, 6.EE.C, 7.RP.A, and 7.EE.B); and linear equations (8.EE.A, 8.EE.B, 8.EE.C, 8.F.A, and 8.SP.A).
As you have learned to make the Finch move, you have varied the speed of the motors and the wait time. You may have spent some time trying to choose exactly the right amount of time to make your Finch travel a particular distance. In this activity, you will use math to find an easier way to make your Finch move whatever distance you choose!
For this activity, you will need tape and a measuring device, such as a yardstick or a tape measure. You will make the Finch move forward with a wheel speed of 80. You will measure how far the Finch moves for different wait times, and then you will use this information to figure out how to calculate the wait time for a particular distance.
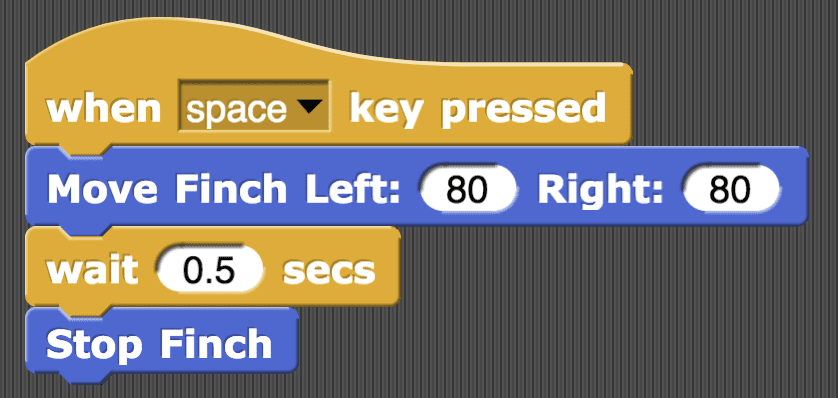
You will start with the simple Finch script shown below. This script will make the Finch move forward with a wheel speed of 80 for 0.5 seconds. The left and right wheel speeds should match. This makes the robot move in a straight line.
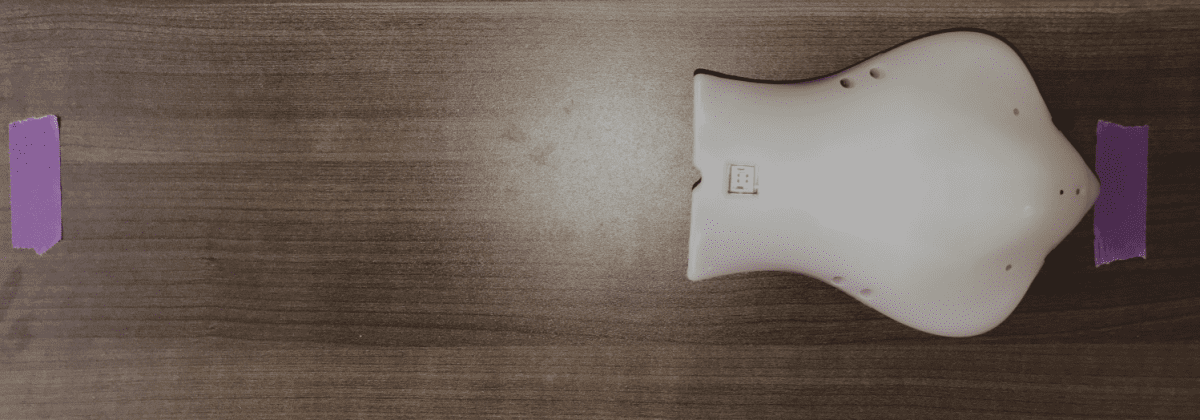
To measure how far the Finch travels, start by putting a small piece of tape on the floor. Place the Finch’s beak directly behind the piece of tape.

Run your script, and put another piece of tape in front of the Finch’s beak.
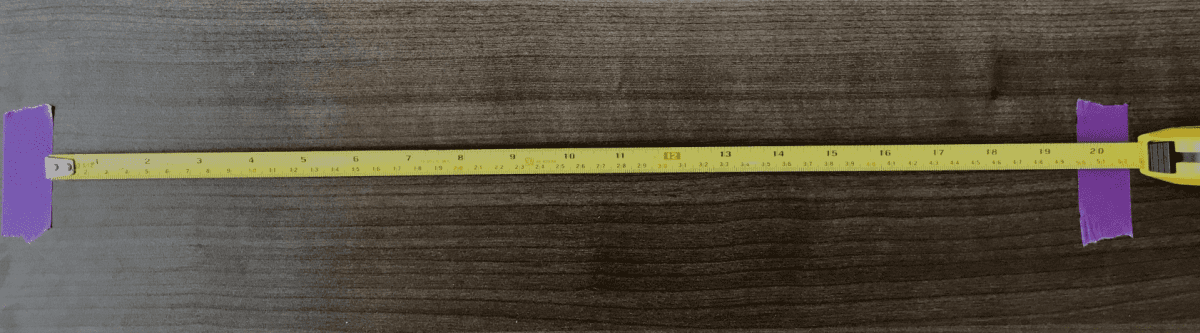
Use your measuring tool to find the distance between the two pieces of tape. Record this distance under “Trial 1” in the data table below.
Repeat this process twice to record two more trials for a wait time of 0.5 seconds.
Next, change the wait time in your script to 1 second. Run this script three times and measure the distance that the robot travels each time. Remember to record your data in the table. Continue to change the wait time and measure distance to complete the data table.
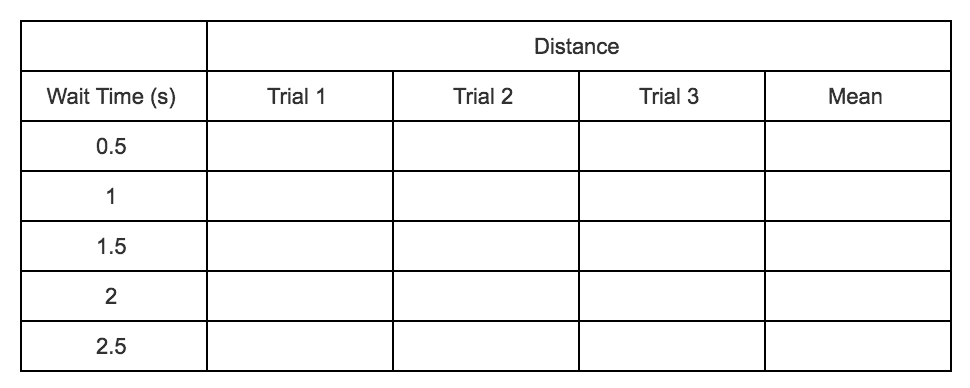
You will notice that the distance can be slightly different from trial to trial, even when the wait time is the same. This is why you took three trials for each wait time. By averaging the results for these trials, you can get a better estimate of how far the robot will move for a particular wait time. Complete the data table by finding the mean distance for each wait time.
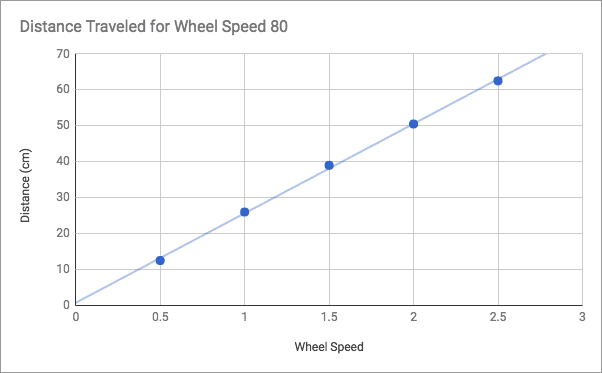
Open Google Sheets or Excel. Create two columns of data. One should contain the wait times from the data table, and one should contain the corresponding mean distances. Create a scatterplot with wait time on the x-axis and mean distance on the y-axis.
Fit this graph with a linear trendline and record the equation of this line. Your graph should look something like the one shown below, but every robot is a little different!
The linear equation you found has the following form: distance = slope*time + y-intercept.
Think about how you can use this equation. How far will the robot travel for a wait time of 3 s? What wait time should you choose to make the robot move 20 cm? 70 cm?
Teacher Note: As an alternative, students can create the scatter plot by hand. Doing this by hand can help students to better form the connection between the different data that they collected.